
Typically, when we envision a good time or a humorous meme, we don’t associate them with x and y axes or data labels. However, it’s crucial not to confine oneself; the reality is that ingenious individuals can craft entertaining content from virtually anything.
The “Funny Charts” online community is devoted to sharing amusing, inventive, and educational graphs that blend data with humor. From handy guides for crafting insults to statistical analyses of Eminem’s songs, settle in as you browse, upvote your favorites, and don’t forget to share your thoughts in the comments section!
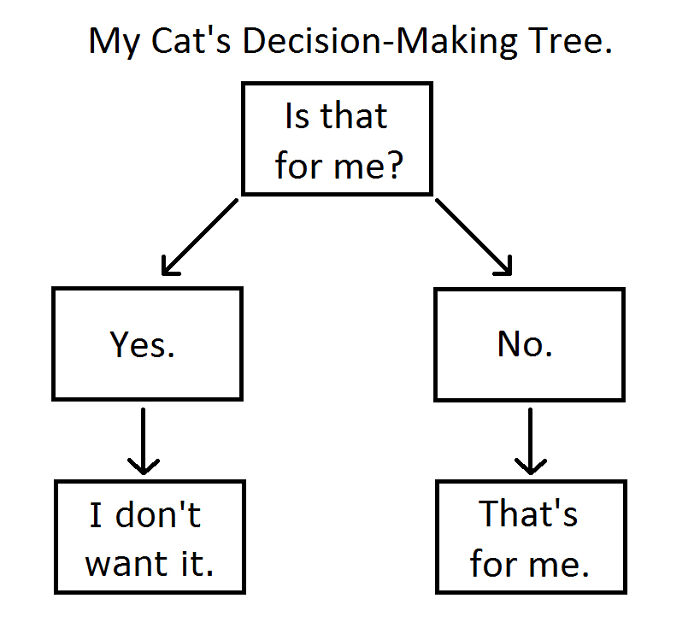
#1 Cat’s Decision-Making Flowchart
#2 The World’s Most Precise Pie Chart
#3 Mathematical Musings
It’s quite conceivable that individuals with a penchant for the arts could find themselves drawn to engaging with data presented in this manner. Research indicates that visual cues play a significant role in the learning process.
While one might argue that a graph is merely a presentation of words and figures arranged on a matrix, not a paragraph, it’s essential to recognize that the visual arrangement is a critical element in how we interpret and assimilate such information.
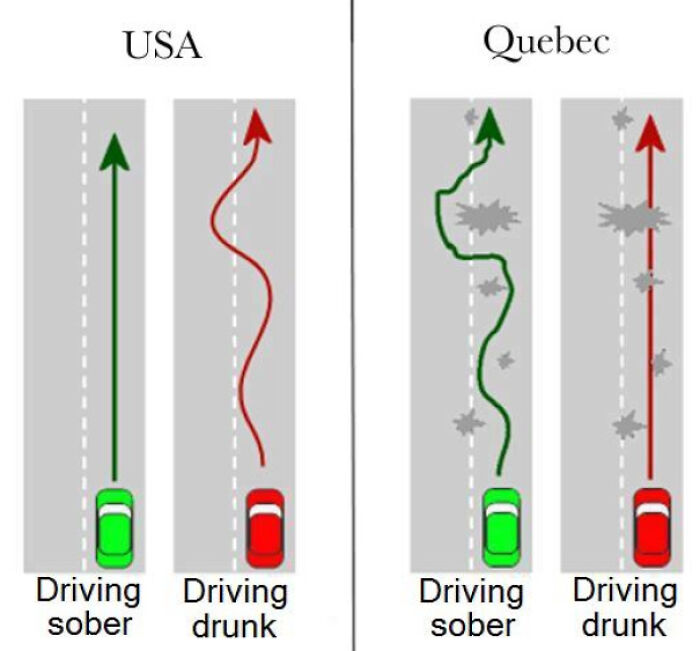
#4 Canadian Visual Representation
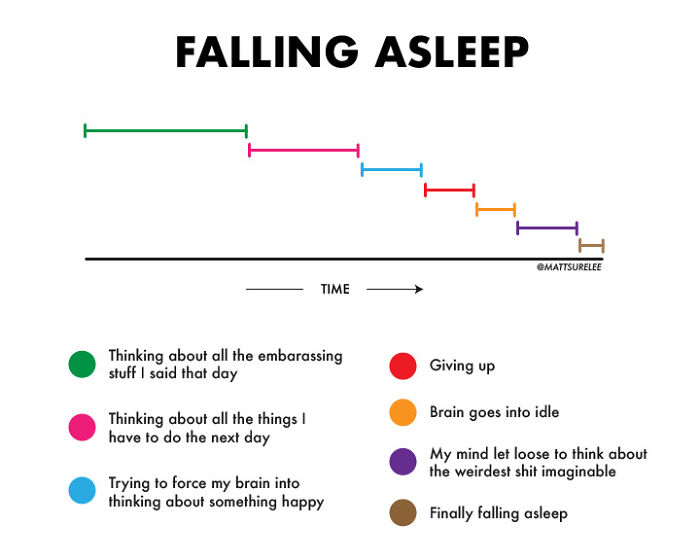
#5 Timeline of Falling Asleep
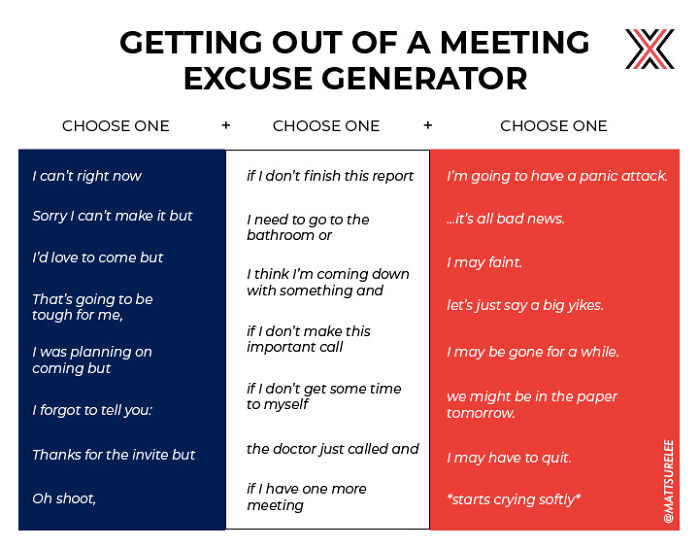
#6 Meeting Exit Excuse Generator
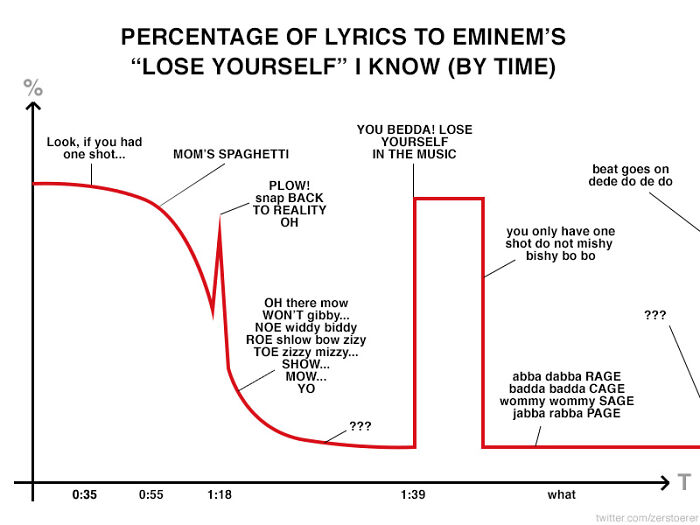
#7 Eminem Song Lyrics
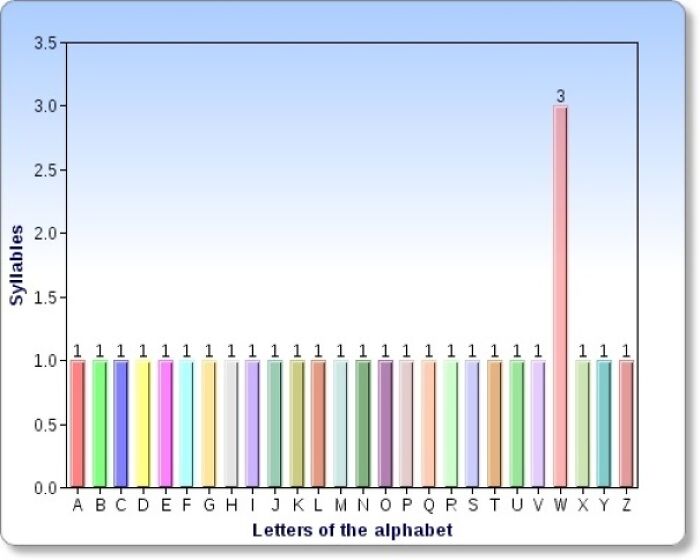
#8 Get Your S**t Together W
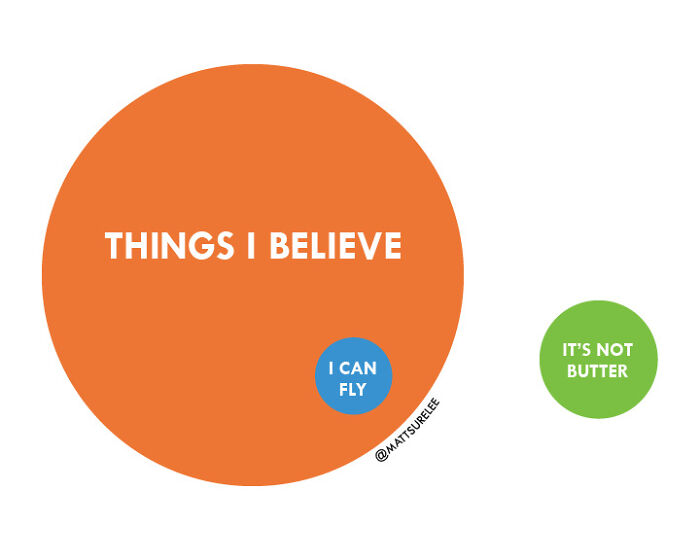
#9 Believe
#10 Drunk Driving
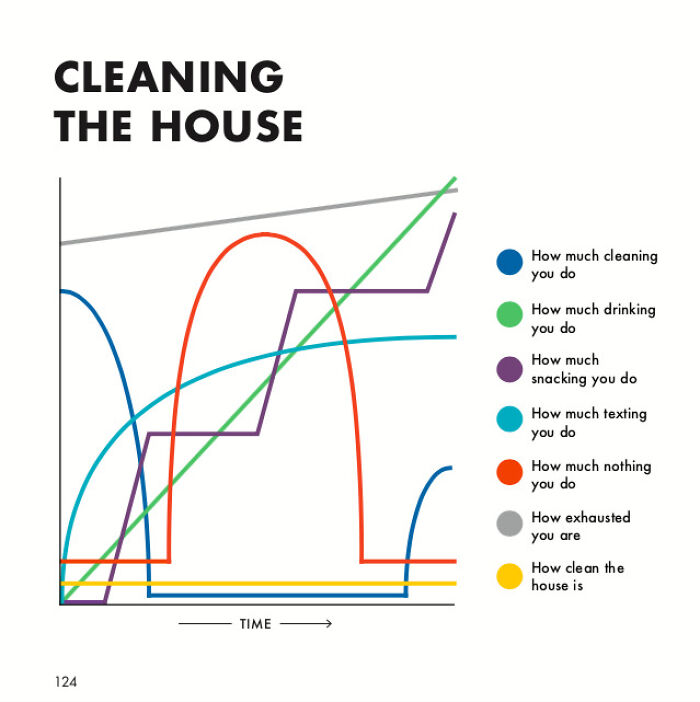
#11 Cleaning The House
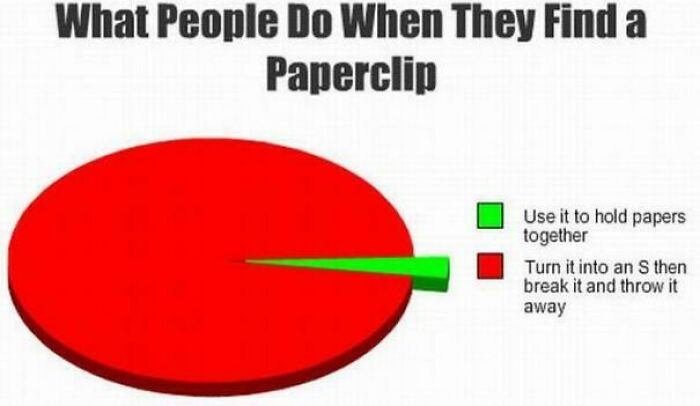
#12 When People Discover a Paperclip
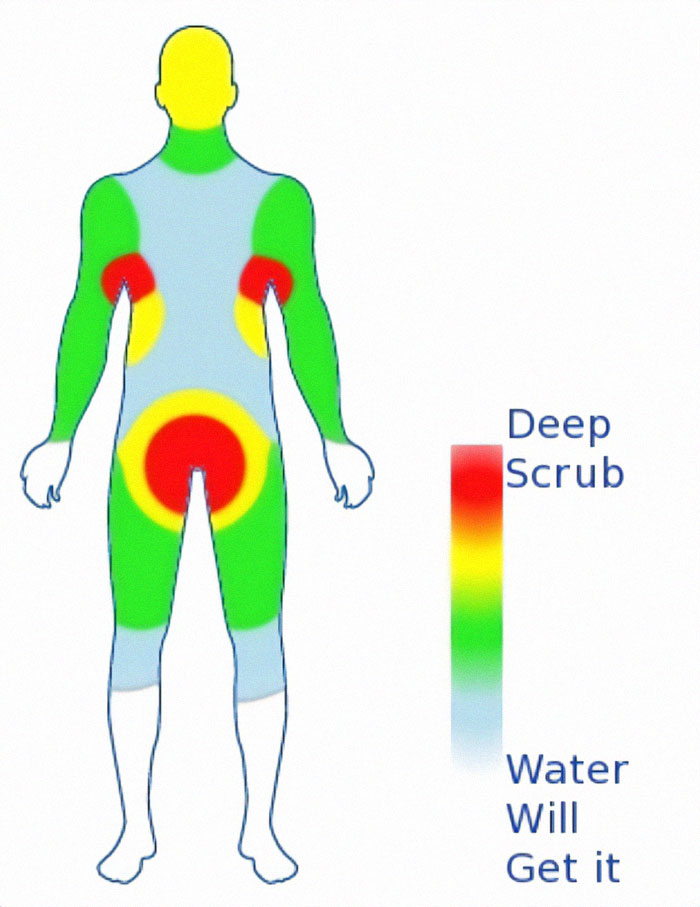
#13 Men’s Shower Routine
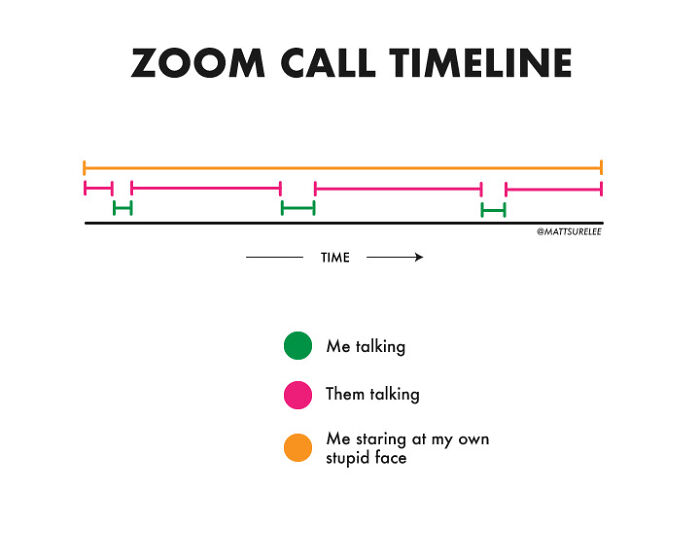
#14 Zoom Call Journey
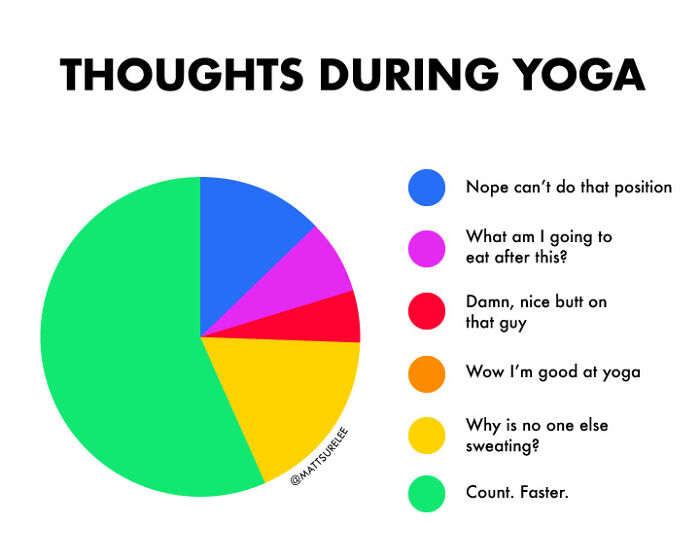
#15 Musings During Yoga
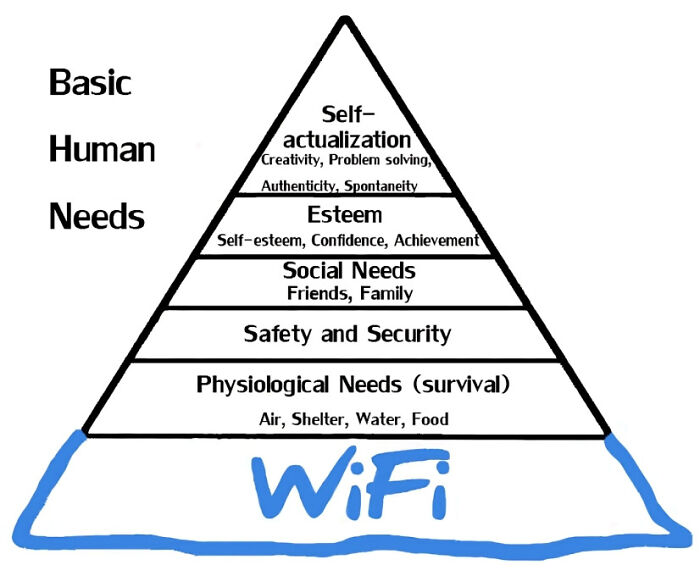
#16 Maslow’s Pyramid of Human Needs
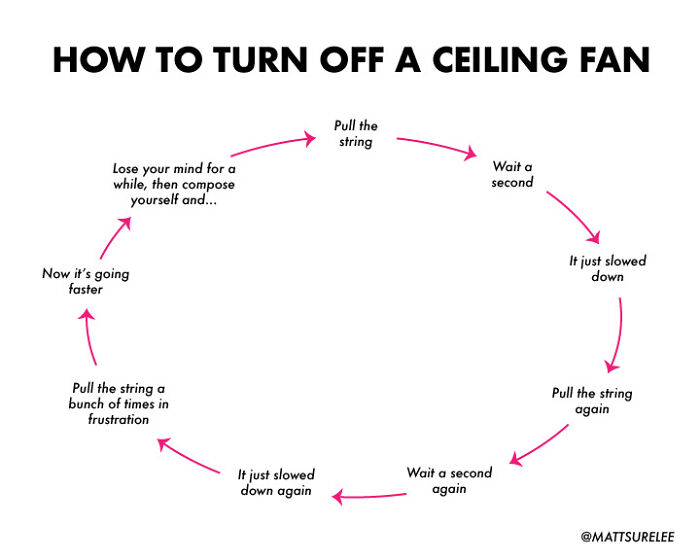
#17 Ceiling Fan Deactivation Guide
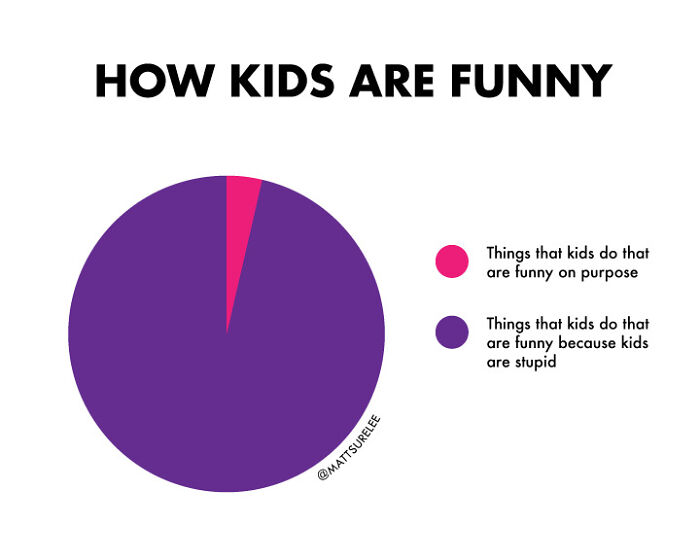
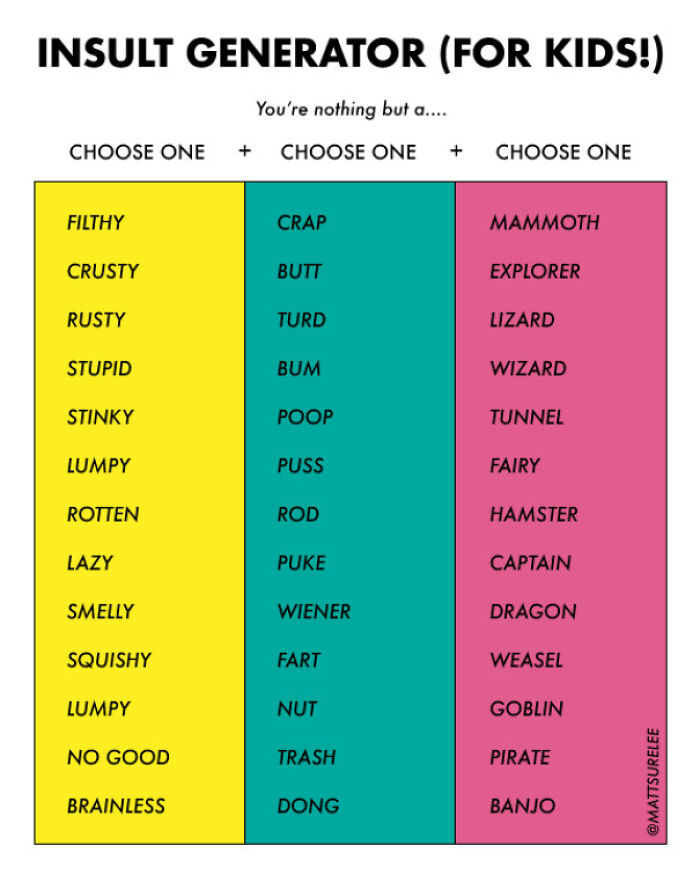
#18 Playful Put-Downs for Kids
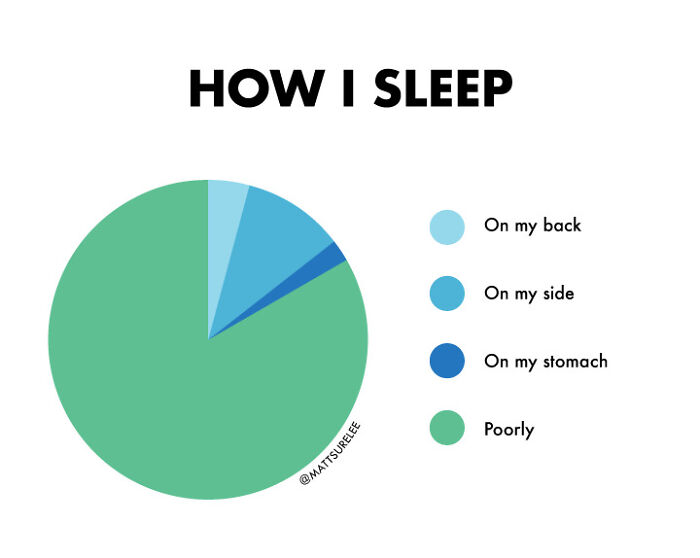
#19 My Sleep Routine
#20 The Humor of Kids